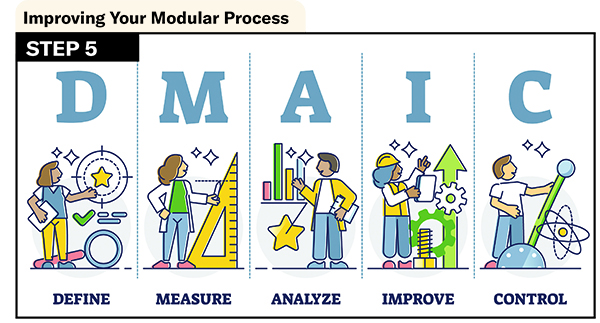
You’ve successfully improved key processes in your offsite factory. How do you ensure that you keep those improvements? By implementing the Control step.
This is the sixth article in my series on the process optimization framework known as DMAIC (Design, Measure, Analyze, Improve, Control). While this five-step method can be used to get more out of any business process, in these articles I’m applying the principles specifically to offsite manufacturing.
In my last article, I walked you through the Improve phase of the DMAIC cycle. That phase serves as the climax of the cycle, where all the work done in the first three phases culminates in solution implementation.
Now that you’ve implemented, tested and validated your solutions, and confirmed that they have addressed the issues in your process, you’re ready for the fifth and final phase of the DMAIC framework: Control.
Let’s say, as detailed in my last article, that during the Improve phase you have raised your cabinet installation process efficiency from 10% to 50%. That’s a real win, as the desired results have finally been attained.
It may seem like the job is done, but don’t fall into the trap of believing that. If you want to keep the gains you’ve worked so hard for, you need to complete the Control phase. After all, this phase exists for a good reason.
The Control phase is where you “lock in” the process improvements you’ve made so that they don’t unravel. The old, flawed processes are likely deeply ingrained as organizational habits and without strong controls in place the new processes you put into place in Step 4 will likely devolve back to their unoptimized former state.
Revisit FMEA
During the Measure phase, one of the tools we use to assess the initial state of each process and determine where to begin making improvements is Failure Modes & Effect Analysis, or FMEA.
FMEA is a tabular scoring tool thatscores and ranks the failure points of a process according to various criteria, which results in a total score, known as a Risk Priority Number, or RPN. An RPN can range from 1 (the best) to 1,000 (the worst), for each failure mode, or issue.
As you start the Control phase, you should revisit the FMEA and recalculate the RPNs for the improved process. For example, as a result of your implemented solution(s), the RPN for your cabinet installation efficiency issue may have gone from 720 to 336. This will allow you to see that positive change has indeed taken place, providing important positive reinforcement and encouragement for the team.
Create A Control Plan
To ensure the continued success of the improved process, you should create a written process control plan for the process owner. The purpose of this plan is to help the process owner and other process workers track and respond to key performance indicators (KPIs). This will ensure that the process remains improved.
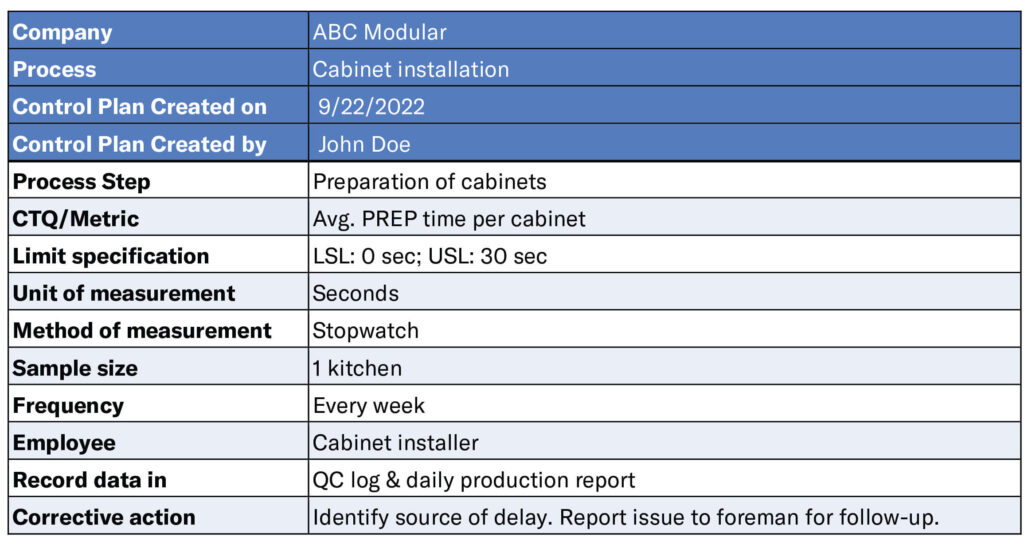
The control plan should be a concise, easy-to-read document, either printed or digital, that shows what to monitor, how to monitor it, what the performance standards are and what to do when the process outputs do not meet the standards. See below for an example:
Whenever possible, corrective measures should be performed by the process workers themselves, rather than requiring a maintenance technician, or outside specialist, to perform. For example, the spot check referenced above is performed by the cabinet installer, rather than by a QC technician or foreman. This minimizes downtime and increases worker engagement and ownership of the continuous improvement process.
Optimally, you should try to find ways to automate the collection of ongoing measurements of the process. This can be done using software, often combined with hardware such as QR scanners, cameras, etc. This allows you to continuously gather data and easily and quickly convert them to real-time process control charts.
Establish Visual Management
In addition to the control plan, teams can establish various visual systems and tools to make it easy to monitor the process going forward. Such tools include 5S workspace organization (which I detailed in Five Days to a More Productive Factory Floor in the May 2022 issue), signs, posted matrices and instructions, auditing boards that let teams keep track of individual or group performance over time, color coding and safety signals.
Standard operating procedures can be distilled into visual representations or graphics for quick reference during the process. Target results can be captured in photos or other graphics and posted in the work area. For example, illustrations of certain complex construction details, wiring or plumbing schematics, etc. could be posted at those stations for reference/confirmation by installation and QC workers.
Control Charts
One of the most common forms of visual process management is the control chart.
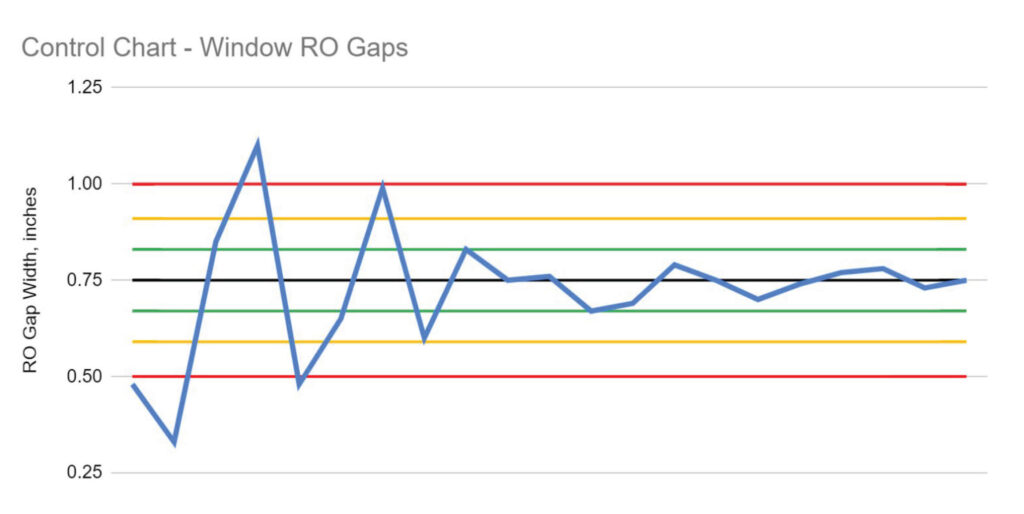
This type of chart can take various forms, but the most common type, illustrated above, includes data points, usually plotted over time, as well as lines representing the target (black), 1 (green) and 2 (yellow) standard deviations from the target, and the upper and lower control limits (red). In the example chart above – showing window rough opening gap sizes – the target result is 0.75 in, with an upper control limit of 1.00 in and a lower control limit of 0.50 in.
Control charts like this show when, and to what extent, a process is out of control (i.e., outside the red lines), so corrective measures can be taken. You can use a control chart to display any numerical process data, such as numbers of defects, test results, panel sizes, framing member lengths, fastener totals, installation times, inventory levels, etc.
Again, ideally, control charts are composed of data points collected automatically via software, or other automated means and displayed in real-time, on a monitor on the factory floor, for example. If that is not possible, someone can be assigned to periodically collect the data and update and display the chart manually. However, this method is much less effective than an automated system at catching and correcting process issues as they arise.
Dashboards
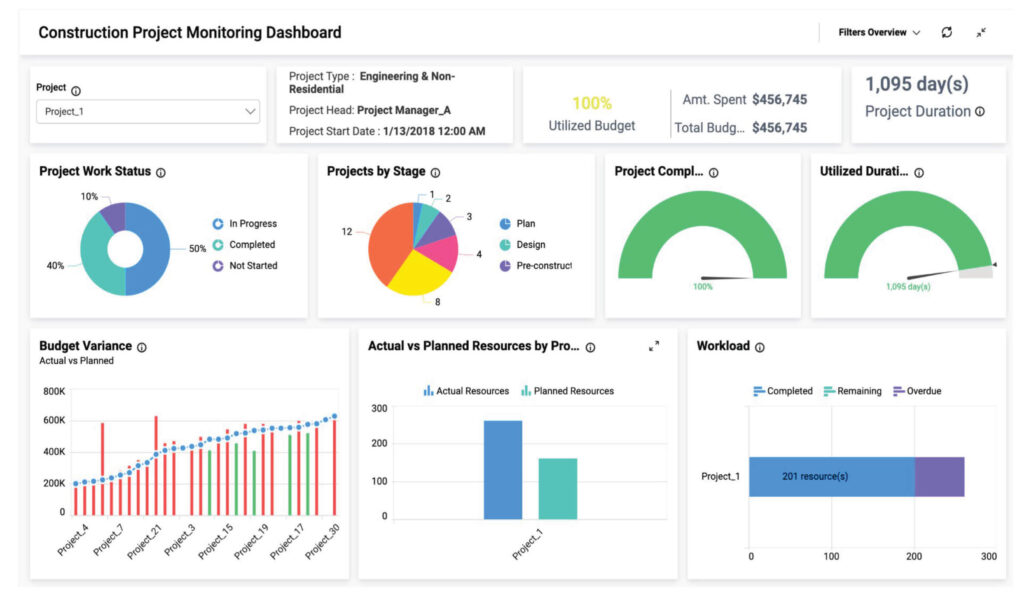
It’s likely that your process has (or will have if it doesn’t yet) multiple Key Performance Indicators, or KPIs, that you need to track on an ongoing basis. Visually monitoring multiple KPIs is often done with a KPI “dashboard.” This display combines real-time graphical representations of the most critical KPIs for your teams to easily and quickly monitor performance. The example below is generic, but your dashboard could include specific KPIs like modules in progress, project completion levels, labor productivity, production cycle times, Process Cycle Efficiencies by subprocess, profitability, throughput, etc.
Implementing Technology
I’ve said many times that implementing technology before optimizing your process only serves to automate your waste. For example, implementing digital tracking software will not fix a wasteful process; it will only accelerate most of the waste and make it easier to see how wasteful the process is.
However, once the process has been improved to the point of at least being capable of consistently meeting customer requirements, the time may be right to implement certain judicious pieces of technology to help you maintain control of the improved process.
Of course, the process will hopefully continue to improve forever (that’s how continuous improvement works), but software can be very helpful in automating the processes of collecting and reporting data, facilitating process control and further improvements. For example, offsite ERP software systems such as Moducore, Manufacton, Offsight, etc. can automate the process of tracking data such as work progress, cycle times, labor productivity and much more.
Celebrate, Reflect and Respect
Now that the improved process is “locked in” with strong controls to maintain the improvements, don’t forget to take time to celebrate and reflect on the outcome of the project. Recognizing the work of the team members will motivate continuing to make further improvements. Recognition can be monetary, such as gift cards, cash bonuses, etc., but can also take the form of non-monetary rewards, such as public compliments, plaques, etc.
During the celebration and reflection meeting, while everyone is basking in the success of the project, is a good time to start coming up with ideas for future process improvement projects. You could reference information such as the RPNs and root cause Pareto charts on the FMEA, as well as collect new ideas from process owners and workers.
Taking advantage of opportunities like this to build on the success to then immediately repeat the DMAIC cycle will help you to build a culture of continuous improvement.
And that culture is the secret to a truly optimized offsite construction organization.
Daniel Small is a Denver-based management consultant to the building industry. He specializes in Lean Construction and Manufacturing and Six Sigma methodologies. Contact him at [email protected]
