How to Measure Success in Offsite Construction
Walk into many offsite factories and you won’t see glowing dashboards or flashing screens — you’ll see whiteboards, sticky notes and spreadsheets. Data tends to be scattered across laptops, email threads and paper forms. Most teams are attempting to track performance manually while juggling daily production fires.
The result is that leaders struggle to answer basic questions. How long does it really take to build a module? Where do the delays happen? Why are projects late?
The truth is that offsite construction isn’t suffering from too much data — it’s suffering from bad data. The numbers that do exist are often incomplete, inconsistent, or disconnected from daily decisions.
Lean thinkers know that measurement isn’t about technology or dashboards — it’s about learning. The goal isn’t to collect more data; it’s to collect the right data and to use that data to make decisions that result in better workflow. Done right, metrics become the language of improvement. Done wrong, they’re just noise or paperwork.
This article will help you focus on what really matters — flow, quality and customer value. It will show you how to measure progress even in a low-tech environment.
Why Measure?
In traditional manufacturing, metrics are often used for reporting — for instance, to show compliance with regulations or to track progress towards production quotas. Take the classic example of a factory that proudly tracks daily output, but can’t explain why projects still take 12 weeks to complete. That kind of tracking isn’t Lean — it’s busyness disguised as progress. Nothing is improving transported over the road In Lean manufacturing, metrics have a different purpose: they’re learning tools. They tell the story of how value flows (or doesn’t) through your processes. Lean metrics look for waste, not vanity. They reveal where time, motion and materials are misaligned with customer demand so that management can identify areas of improvement.
When measurement becomes about learning, not judging, improvement accelerates. The question shifts from “How fast are we working?” to “How well is value flowing?”
Strategy, Flow and Frontline
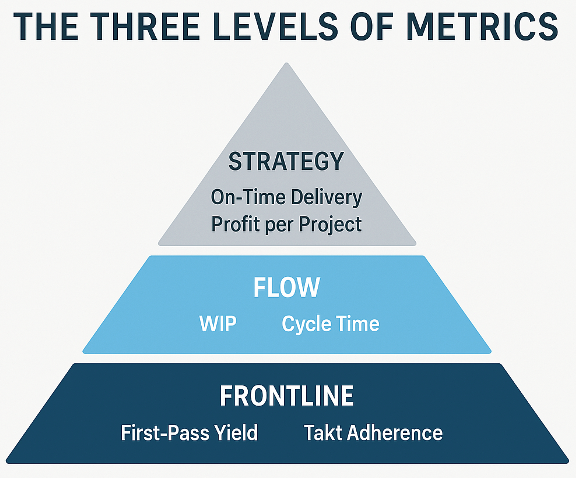
Lean metrics form a hierarchy that looks like a pyramid, with Strategy at the top, Flow in the middle, and Frontline metrics at the base. Each level serves a distinct purpose but must stay connected to the others. Measure only at the top and you’ll miss the problems on the floor. Measure only at the bottom and you’ll lose sight of the strategy.
- Are We Winning the Right Game?
Strategic metrics tell you whether the company, as a whole, is delivering value to the customer and making money while doing it. They measure things like on-time delivery, order-to-install lead time, or profit per project.
One modular builder tracked only revenue per quarter — until they realized projects were profitable on paper but bleeding cash in rework. When they added rework cost per project to their strategic dashboard, the real picture emerged.
The lesson? Pair financial and delivery metrics with indicators of quality and flow. Lagging numbers alone don’t tell you how to get better — they just tell you what already happened.
- Is Value Moving Smoothly?
If Strategy is the scoreboard, Flow metrics are the play-by-play. They measure how work moves through your process and include work-in-progress (WIP), takt time, cycle time, throughput and queue time.
One pod manufacturer discovered that modules weren’t late because production was slow — they were late because WIP piled up between electrical and drywall stations. By visualizing flow and limiting WIP, they cut total cycle time by 30%.
The secret to good Flow metrics? Make them visible. A magnetic board, whiteboard, or simple dashboard that shows WIP at each stage beats a spreadsheet buried in SharePoint any day.
- Are Teams Improving Every Day?
Frontline metrics are where Lean lives and breathes: first-pass yield, rework rate, takt adherence, 5S scores and problem-solving activity.
One factory team began posting a simple red-green chart each morning showing whether each station hit its takt time the day before. What followed was powerful — not finger-pointing, but curiosity. “Why did framing run late?” “How can we fix it?” That’s the spirit of continuous improvement.
When teams own their metrics, they own their outcomes.
Measuring Cause and Effect
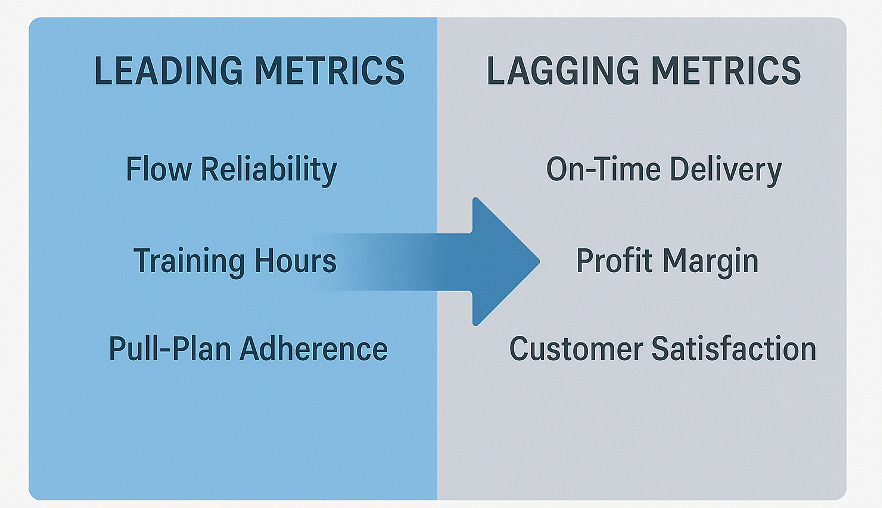
In Lean, we distinguish between leading metrics (inputs) and lagging metrics (results). Leading metrics tell you how you’re likely to do. Lagging metrics tell you how you did.
Think of a football team. The score at the end of the game is lagging. The number of completed practices, drills and plays executed correctly are leading. You can’t change the score once the whistle blows, but you can change how you practice.
For offsite construction, flow reliability — the percentage of work completed as planned — is a powerful leading indicator of on-time delivery. If only 60% of tasks are completed each week, it doesn’t matter how much you “push” — projects will slip.
An effective dashboard should balance both: roughly 70% leading, 30% lagging. Otherwise, you’re just driving by looking in the rear-view mirror.
When Metrics Mislead
Not all measurement is good measurement. Here are five ways metrics can go wrong:
- Measuring too much. KPI creep turns dashboards into data swamps. When everything’s important, nothing is.
- Chasing efficiency over effectiveness. Making lots of the wrong thing faster is still waste.
- Ignoring the Gemba, or the location, where value is created. Data without context breeds false conclusions — go out onto the factory floor and see the work.
- Punishing bad metrics. Don’t use numbers as weapons for punishing people. If you do, they will stop telling the truth. Instead, use them to drive improvement.
- Celebrating short-term gains while ignoring bigger issues. One modular factory hit a “record productivity month” — then spent $250,000 fixing hidden quality problems the next month.
Lean metrics should reveal cause and effect, not create fear or false confidence. The goal is discovery, not discipline.
When Metrics Mislead
A good metric doesn’t live in a spreadsheet — it lives in conversation. Data must connect to daily decisions. It must drive action. To make this happen, you need to look at it daily, weekly and monthly.
Daily visibility: Posting real-time flow and quality metrics at each work cell will ensure that every operator can see how today compares to yesterday.
Weekly huddles: Short, focused meetings are a great way to link the data to countermeasures. Questions to ask include: What have we learned in the past week? What’s the next experiment?
Monthly reviews: This is an opportunity to step back and study trends. Are we solving the right problems? Are improvements sticking?
One offsite manufacturer created a “three-tier dashboard” to track these:
- Tier 1 (Daily): Cell metrics like takt adherence and first-pass yield.
- Tier 2 (Weekly): Flow metrics like throughput and schedule reliability.
- Tier 3 (Monthly): Strategic metrics like margin per project and customer satisfaction.
Each level drives the next — data rolls up, insights roll down.
The Lean lesson here is that metrics are only as valuable as the feedback loop they feed. You need to measure, discuss, improve, repeat.
Implementing AI
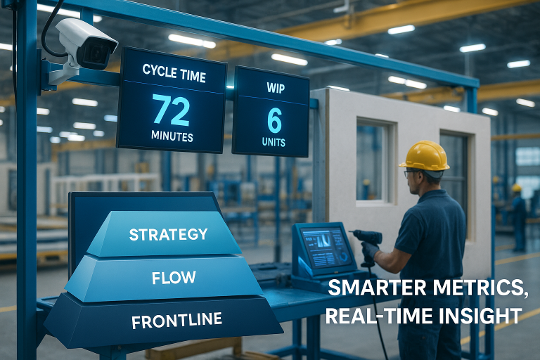
The future isn’t about more metrics. It’s about smarter metrics — ones that capture real behavior, not estimates.
Technology is rapidly changing how factories measure flow. Cameras, sensors and AI tools can now track cycle times, worker movement and bottlenecks automatically — no stopwatch required.
In one wall-panel plant, a simple AI camera tracked how long panels sat idle between stations. Within weeks, the team uncovered 18 hours of hidden waiting time per week — something their manual logs never caught.
If you’re considering automation, start small. Pick one process and one variable to measure, such as weld time per module. Once you prove the value, expand. The best systems evolve through learning, not big launches.
From Data to Decisions
The most successful offsite manufacturers aren’t those with the most data — they’re the ones who have learned how to turn data into decisions. They use metrics as mirrors, not as scorecards.
So, this month, take a walk through your factory. Look at every chart, board and dashboard. Ask yourself:
- Does this metric help us identify waste?
- Does it improve flow?
- Does it create customer value?
Because in the Lean factory, the best metrics don’t decorate the wall — they drive the work.
Daniel Small is Founder and CEO of Da Vinci Consulting and creator of the LeanOffsite™ program. He helps modular and prefab manufacturers streamline flow, reduce waste, and boost profitability through Lean Six Sigma and Jobs-to-Be-Done principles. Contact: [email protected] | www.DaVinciConsulting.co | LinkedIn.Com/in/LDanielSmall