Five reasons why it’s a lie
Housing is a basic human need, but a lack of affordable housing is fueling a housing crisis here in the US. The National Association of Realtors claims that we need around 6.8 million homes to meet current demand.
This has put the construction industry under intense scrutiny. We’re being told to build faster, cheaper and in larger quantities. But traditional crews can’t keep up with demand while also battling price swings, supply chain issues and inflation.
The industry has turned to 3D concrete printing, modular construction, temporary shelters and more in search of solutions. Desperate families with limited housing options are looking to squeeze into tiny homes and ADUs (accessory dwelling units). Homelessness has grown and some cities have become unrecognizable. During a recent visit to the San Francisco Bay area, I was shocked to see every street lined with tents, RVs, cars missing wheels and makeshift shelters. It seems like a new article is released daily about the lack of housing and “the inventory shortage.”
We are so caught up in blaming the construction industry that we haven’t paused to ask if the entire situation is artificial and haven’t taken a hard look at where housing is headed. Despite the above problems, an analysis of housing and population data reveals a scary trend toward oversupply. There are many parallels between today’s landscape and the housing bubble of 2005.
In this article, I’ll look at five facts about the “housing crisis” that need more attention.

1. Declining population growth
Until the Great Recession of 2008, the US birth rate hovered between 65 and 70 births per 1,000 women. However, after 2008, the birth rate crashed and never recovered. As of 2020, the US birth rate was 55.8 births per 1,000 women, a decline of almost 20% from 2007. This can be attributed to lower fertility rates and couples prioritizing career and financial security over children.
At the same time, the number of deaths has spiked considerably. In 2005, the US saw 2.4 million deaths per year, a number that has since risen to around 3.1 million. It is expected to increase further as the Baby Boomer generation ages.
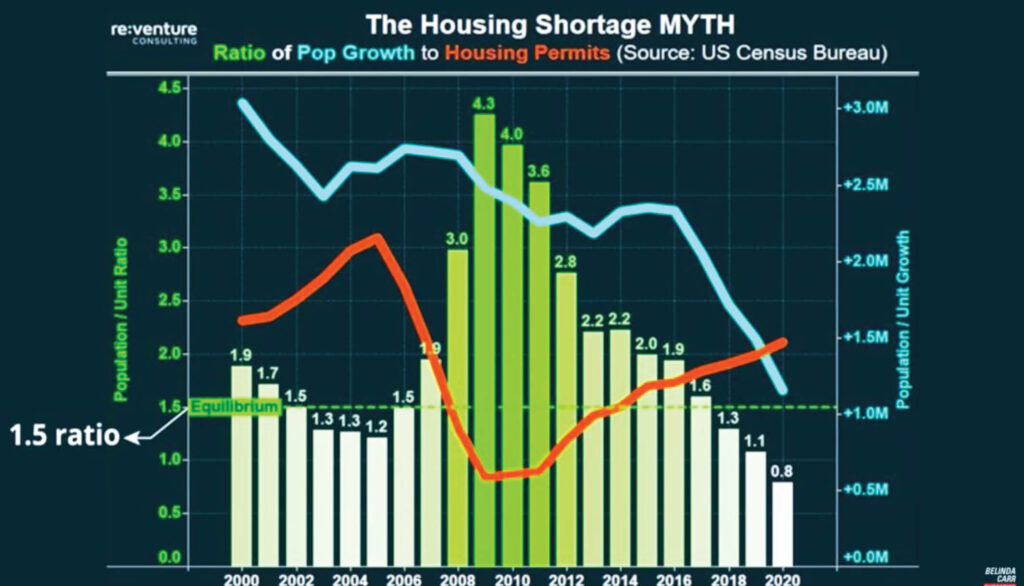
Nearly every article about a housing crisis and inventory shortage includes a graph showing the number of housing permits issued per year. It tells us that new construction dropped drastically after the great recession and never fully recovered. Permits for single-family homes peaked at 1.7 million in 2005, then fell to 400,000 in 2010, a 70% drop. Of course, more permits were issued as the industry recovered, but by 2020 they had only risen to one million—that’s 700,000 fewer permits than in 2005.
It’s instructive to overlay this graph with the population growth graph. The ratio of population growth to new housing permits should be around 1:1.5, meaning 1.5 people added to the population for every 1 permit. But only 0.8 people were added in 2020 to the US population for every permit issued. For the first time in US history, more units were permitted than the population added. That tells me we’re heading towards oversupply, not a shortage.

2. The number of people per unit
When times get tough and there’s a true housing shortage, people turn to shared housing to help make ends meet. It’s difficult to cut the cost of food, transportation and healthcare, so the first compromise a lot of people make is to lower the cost of housing by sharing homes and accepting roommates.
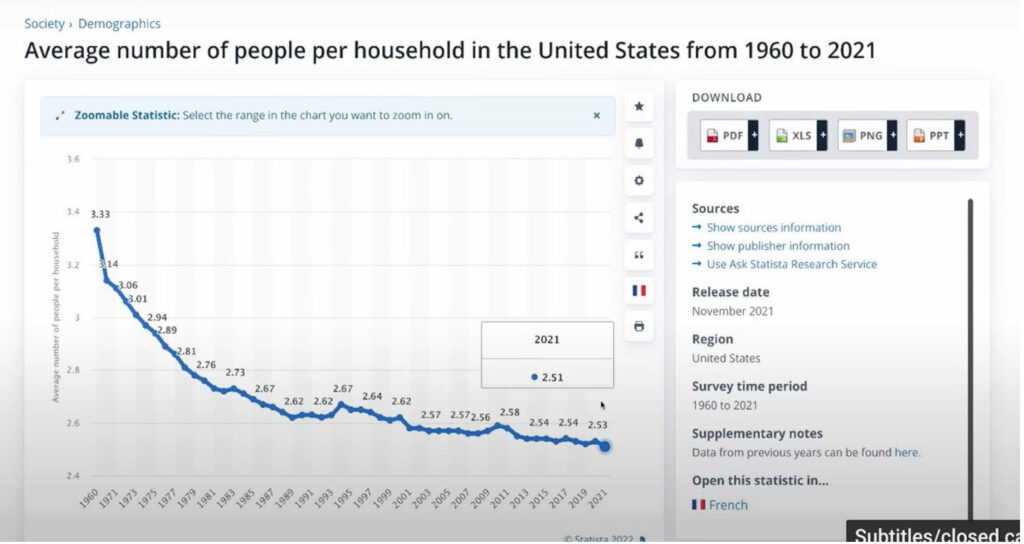
If we were truly facing a housing crisis, the number of people per unit in the US would be between five and eight people per house, as is the case in several African and Asian countries. However, the number of people per US household is one of the lowest in the entire world. We’re actually at a historic low of just 2.49 people per household.

3. The number of rental units
According to Redfin, investors purchased a record $64 billion worth of homes in 2021, an average of 15% of the homes sold in major metropolitan areas. The percentage is much higher in certain cities like Washington, Atlanta, Charlotte, Miami, Jacksonville and Phoenix, where 25% of homes were bought by investors.
Neighborhoods, where a majority of residents are minorities, have been heavily targeted, according to an analysis of Redfin data undertaken by The Washington Post. Minorities usually live in areas that are undervalued or lower priced, which makes those areas more attractive to investors. This drives up prices. Where I live in Texas, wealthy out-of-towners and investment firms have been buying all available housing at prices above market rate, driving out anyone who doesn’t have the cash upfront.
However, media coverage of investors buying rental units is highly skewed. For instance, a VOX article from June 2021 claims that Wall Street, private equity firms and institutional investors are not to blame for pushing prices upwards. Other media outlets also seem uninterested in this story.
To find out why, you need only follow the money. Jimmy Deringer, a broker with Keller Williams, has posted an excellent YouTube video in which he uncovers a trail of cash and influence. Comcast owns VOX and NBC. The second largest shareholder of Comcast is investment firm BlackRock, which has been on a nationwide buying spree of single-family homes. BlackRock also owns Time Warner, Disney and News Corp. These companies collectively control more than 90% of the US media landscape.
I know I’m approaching conspiratorial territory, but this incessant, biased news coverage on the housing shortage, when compared to the numbers, doesn’t add up.

4. Interest rates
Low-interest rates have been driving up home prices for years. Until recently, ultra-low interest rates gave individuals the ability to buy much more homes for their money. Low-interest rates also made it cheaper to buy than to rent, which created additional demand for homes.
Of course, the US Federal Reserve has been hiking up interest rates to stabilize inflation, raising the 30-year fixed rate mortgage to over 5.5%. This will reduce home demand and increase the supply, as we have seen in the past.

5. A mismatch of housing types and incomes
Trendy markets like Miami, Denver, Atlanta and Austin have an out-of-control demand for housing, while other places still have plenty of vacant houses. The work-from-home revolution over the past two years has exacerbated the problem. Currently, someone with a salary from New York can move to a less expensive location, buy a house and save substantial money.
Companies are catching on to this phenomenon and realizing that they can pay remote workers 30-40% less than local workers. Big names in tech like Google, Facebook, Twitter and Microsoft have indicated that they will adjust employees’ pay based on where they live.
What’s Ahead?
Now let’s discuss the parallels between today’s housing market and that of 2005. Back then, we were told that the US was short millions of houses and that decades of low inventory were to blame. Sound familiar? When the housing bubble burst, however, we suddenly had a surplus.
Shortage of all housing isn’t the real issue—the real issue is the lack of affordable housing, with millions of homes tied up as investment property. Unfortunately, the insane pressure to build, build and build more has created fraudulent and deceitful companies that claim to be the solution to homelessness and lack of affordable housing. They have raised millions of dollars on an idea, not a viable product.
As much as I hope we don’t have a crippling recession, we need some sort of reset button to weed out all these phony companies.


