This is a valuable tool for optimizing your offsite factory. Here’s how to use it.
As a leader in offsite construction, one of your most important and persistent responsibilities is making sure your manufacturing process is optimized and continuously improving. After all, the whole reason you’re in business, and what will keep you in business, is making a profit by providing your customers with superior value. And the engine that creates that value is your manufacturing process.
To optimize and continuously improve any process, you must understand it intimately. And one of the most powerful tools for gaining and communicating that understanding is the Value Stream Map (VSM). In this article, I define what a VSM is and demonstrate how to use it to understand and improve your offsite process.
What is a Value Stream Map?
A VSM is a quantified, pictorial representation of a process, including the flow of products, people, ideas and information. It provides you with the big picture of the process in its current state, helps you visualize an improved future state and facilitates communication about the process within your organization.
Processes can involve the movement, or flow, of seven different components:
1. Raw materials
2. Parts
3. Products
4. People
5. Equipment
6. Information
7. Engineering
What makes a VSM so powerful is that it’s one of the few tools that can capture all the different flows in a process, though it’s often focused primarily on raw materials, parts and products.
Creating a VSM
Creating a VSM consists of the following steps:
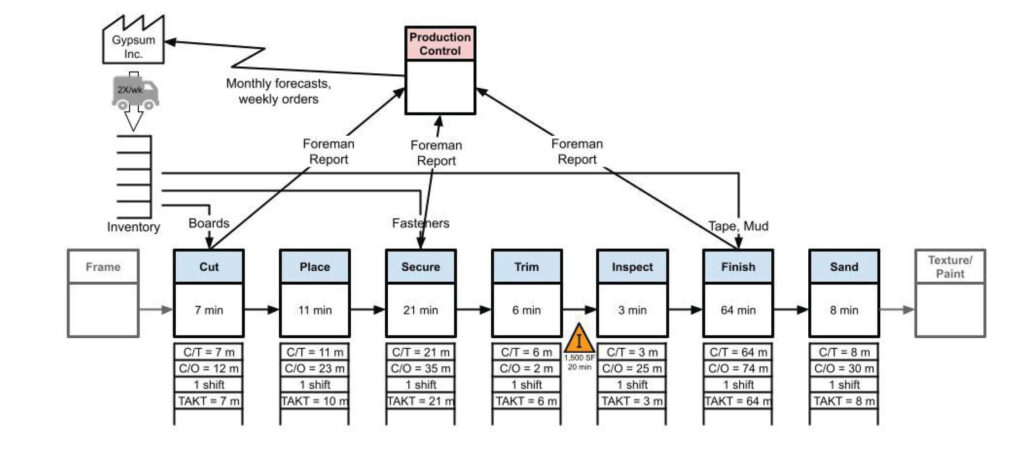
1. Select the process to be mapped. A VSM can be created for any process, or subprocess, in your operation. For example, you should have a VSM for your overall offsite manufacturing, or master process (in which you produce the finished product for sale to your customers). You may also find it beneficial to zoom in on any (or all) of the subprocesses within that master process. For example, you could map each of your stations, or each trade activity in the construction process, such as drywall installation and finishing (see the example below).
2. Collect data. Before you can begin mapping the process, you need to collect some basic data on the current state of the process, as this data will be a critical part of the VSM. Although you can eventually create a future-state VSM as well, start with the current state. Walk the process in person, carefully observing and measuring it, speaking with process workers and recording your observations.
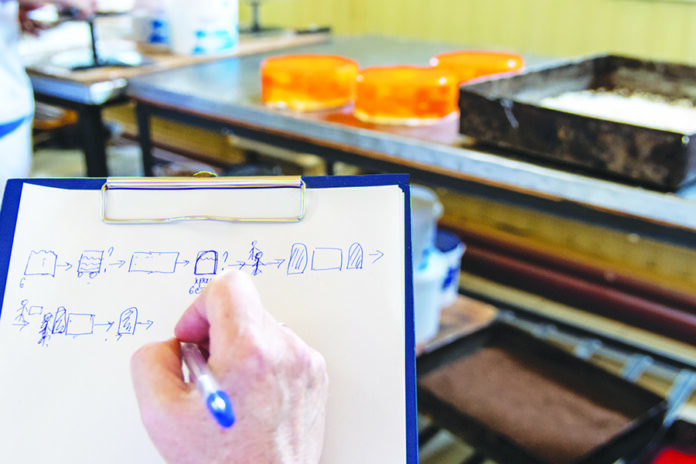
3. Create the VSM drawing. Although you can eventually convert the VSM to a digital version for clear communication and easy updating, you can start with a simple hand sketch.
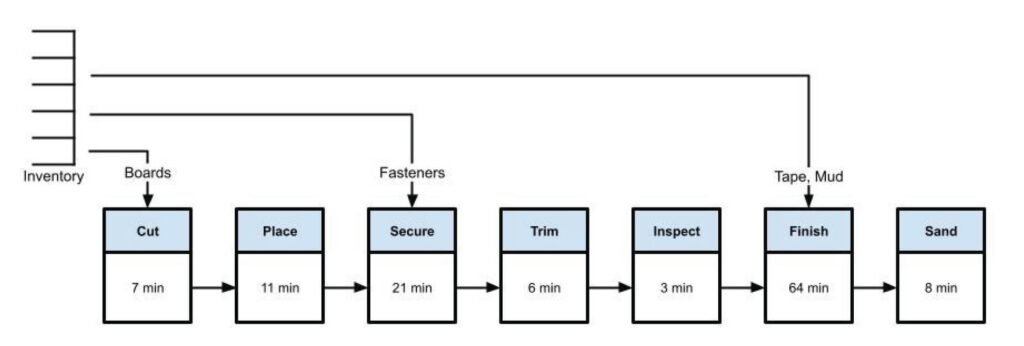
Begin by sketching the major process steps, along with their cycle times. To illustrate, I will use the example of drywall installation and will assume the following process steps:
● The gypsum board is cut to size (as needed) for hanging
● It’s placed in position on the assembly (wall, ceiling, etc.)
● It’s secured to the structure
● It’s trimmed to shape (around openings, etc.)
● It’s taped and mudded
● The surface is sanded

[Seems like he’s missing the ‘inspect’ step in the bulleted list above…]
Next, add the raw material flows to/from on-site inventory for each applicable step:
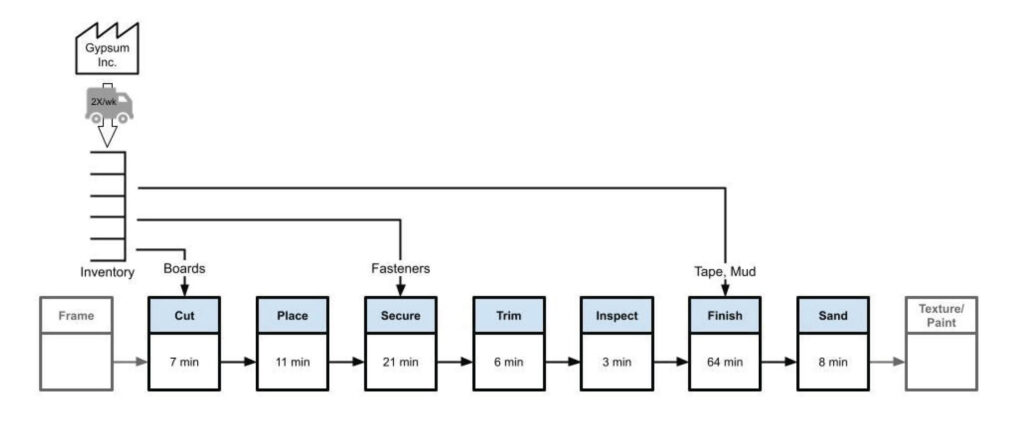
Then add any outside interactions, such as with suppliers, customers and shipments, and interactions with other parts of the factory. In the example below, the framing subprocess and the texture/painting subprocess are done internally.
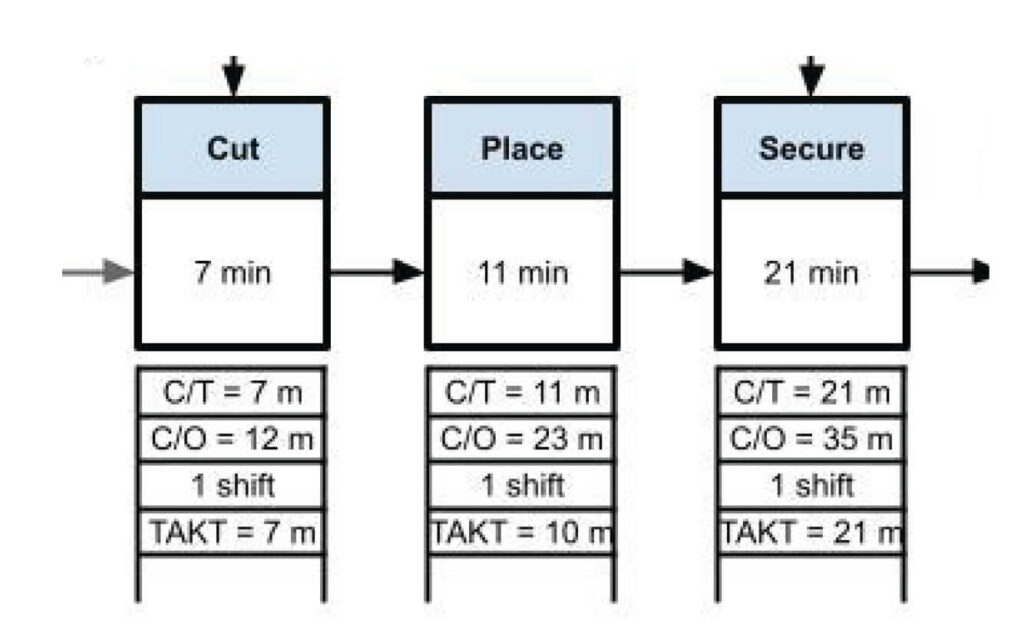
Add data boxes for each step in the process. Data boxes are a critical part of a VSM, as they include much of the meat that gives the VSM its value. Common data are things like Cycle Time, Changeover Time, number of operators, Time worked in a shift, batch sizes and TAKT Time.
Add inventories and controls. Wherever inventory waste, or buildup of output, exists in the process, add a quantified Inventory signal (the orange triangle in the illustration below), to illustrate possible locations and sizes of potential inventory waste. Then add any controls for the process, such as production control, including any associated flows of information.
Using a VSM in Process Optimization
If you have read my series of articles on the DMAIC Cycle (published in the June through November issues of Offsite Builder) you won’t be surprised that a VSM can earn its keep during each of DMAIC’s five phases.
- In the Define phase, it can help you deeply understand the process you’re addressing in its current state and can serve as a valuable communication tool for your team.
- The data collection you conduct for the VSM builds a strong foundation for the Measure phase, by identifying possible data collection points and data flows.
- During DMAIC’s Analyze phase, the team can use the VSM to help identify locations and root causes of problem points in the process.
- And finally, during the Improve phase, the team can use the current-state VSM to create a future-state VSM to guide solution implementation, as well as to help identify potential issues in implementation and into the Control phase.
Conclusion
There are many things you can (and should) do to optimize your offsite manufacturing process. But one of the most important is to create a Value Stream Map of the process. Even if you do nothing else, creating a well-thought-out VSM will help you understand your process better and reap dividends for your productivity down the road. So get sketching today.
Daniel Small is a Denver-based management consultant to the building industry. He specializes in Lean Construction and Manufacturing and Six Sigma methodologies. Contact him at [email protected]


