You’ve collected your data. Now you need to analyze it.
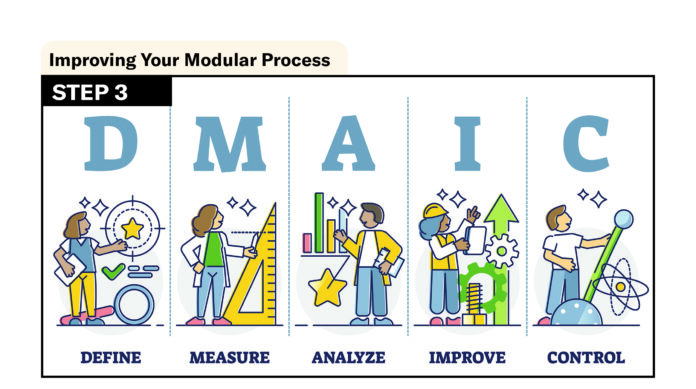
This is the fourth article in my series on the process optimization framework known as DMAIC (Design, Measure, Analyze, Improve, Control). While this 5-step method can be used to get more out of any business process, in these articles I’m applying the principles specifically to offsite manufacturing.
In my last article I laid out Step 2, the Measure phase. If you’ve implemented the Measure phase, you should now be in the habit of collecting relevant data about all of your processes on an ongoing basis. The data you’re collecting should provide you with at least a basic clue as to which outputs are satisfactory, and which are unsatisfactory. For example, your data may tell you that your defects per assembly are too high, that a certain workstation is taking too long to complete its work, or that your Process Cycle Efficiency is only 13%.
Now that you have that data in hand—and, ideally, a system for ongoing data collection—it’s time to begin analyzing it to identify, quantify and prioritize the issues that need to be addressed.

work in the area of the process that has the challenge) and sketch out a diagram like the one above.
Root Cause Analysis
The Analyze phase is all about uncovering the causes of your process issues, so you can fix them. The job here is to figure out why those outcomes are unsatisfactory.
One of the fundamental activities of the Analyze phase is what’s known as Root Cause Analysis (RCA). This is where you and your team of experts (the line workers) deeply consider and discuss the possible causes of these issues. When discussing a problem, you and your team need to progressively dig deeper until you arrive at the root cause.
One of the most common and powerful tools for Root Cause Analysis is a simple graphic known as a fishbone diagram.
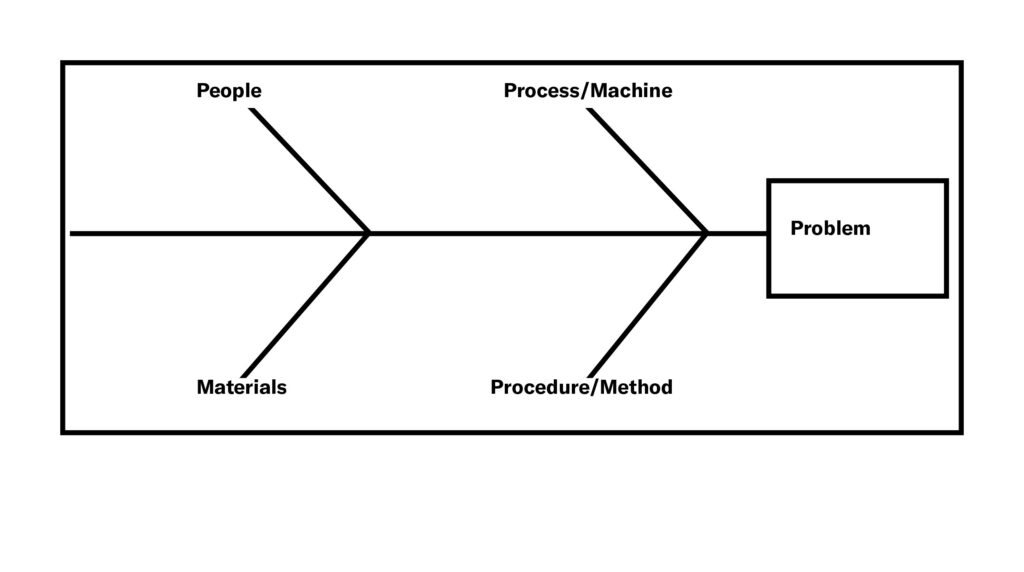
To conduct a Root Cause Analysis using a fishbone diagram, gather your team (the front-line workers who work in the area of the process that has the challenge) and sketch out a diagram like the one above.
The bones that connect to the spine of the diagram are:
- People—Anyone who carries out, or interacts with, the process in question, including line workers and managers.
- Process/Machine —The way in which inputs become outputs, including the tools, equipment and machinery needed.
- Procedure/Method—How you define your procedures for getting the work done. These definitions could include written documents, unwritten rules, or standard operating procedures (SOPs).
- Materials—The inputs needed by the process, including raw materials, usables and accessories.
For each category in the diagram, ask the team how something in that category might be responsible for the problem or defect. Capture their ideas either on sticky notes or directly on the diagram. For each idea, ask “why?” at least five times, to get to the root cause of the problem. Then repeat the process for each additional category.
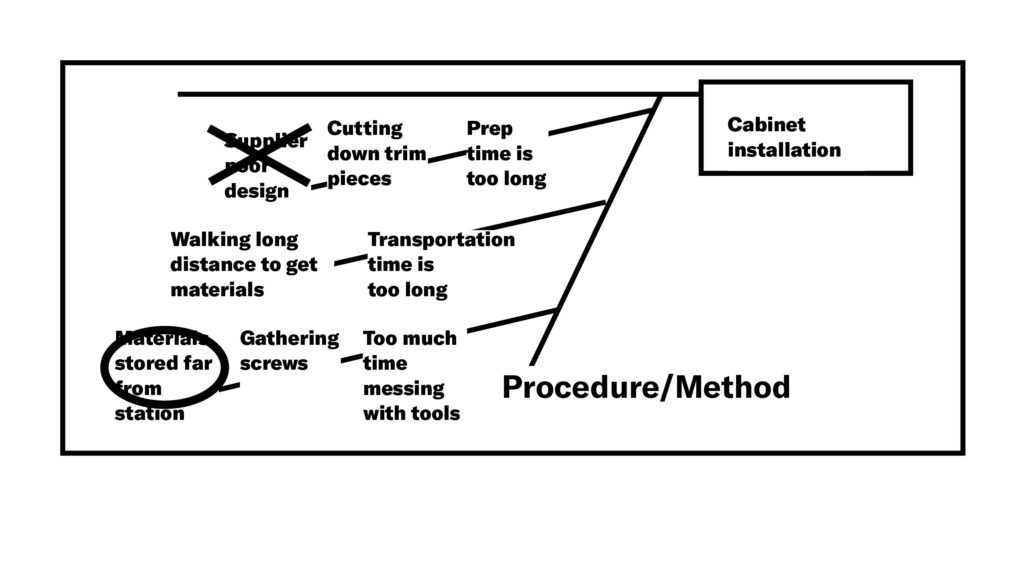
If, for example, cabinet installation is taking too long, this process might lead the team to identify possible culprits as materials that are stored too far from where they’re used. Or, they might conclude that the workstation layout requires too much movement on the part of the worker to reach the tools needed at each step of the process.
Once you’ve captured the team’s ideas in each category, review the ideas, reorganize if necessary and discuss them as a team. Remove any that are proven invalid through discussion. Then decide as a team which root causes seem most likely or highest priority, and circle those as possibilities for further investigation.

In the example above, for instance, the team realized that one potential root cause for their low Process Cycle Efficiency in cabinet installation was the distance at which their cabinet materials are stored relative to the workstation where the cabinets are installed. This root cause can now be further investigated
Pareto Charts
Named for the Italian economist Vilfredo Pareto, the Pareto Principle (AKA the “80/20 Rule,”) reflects the fact that the majority of outputs usually stem from a minority of inputs. You can find examples of this in a variety of settings. Roughly speaking, about 80% of most companies sales will come from 20% of its salespeople and 80% of software problems will be caused by 20% of the bugs. Pareto even observed that 80% of the peas in his garden came from 20% of his pea plants.
How do you make use of this principle? If you have data tying problematic outputs, such as slow cabinet installation, to various inputs or root causes, such as sub-optimal workspace and storage layouts, this tool can help you prioritize the causes and determine where to begin with your corrective measures.
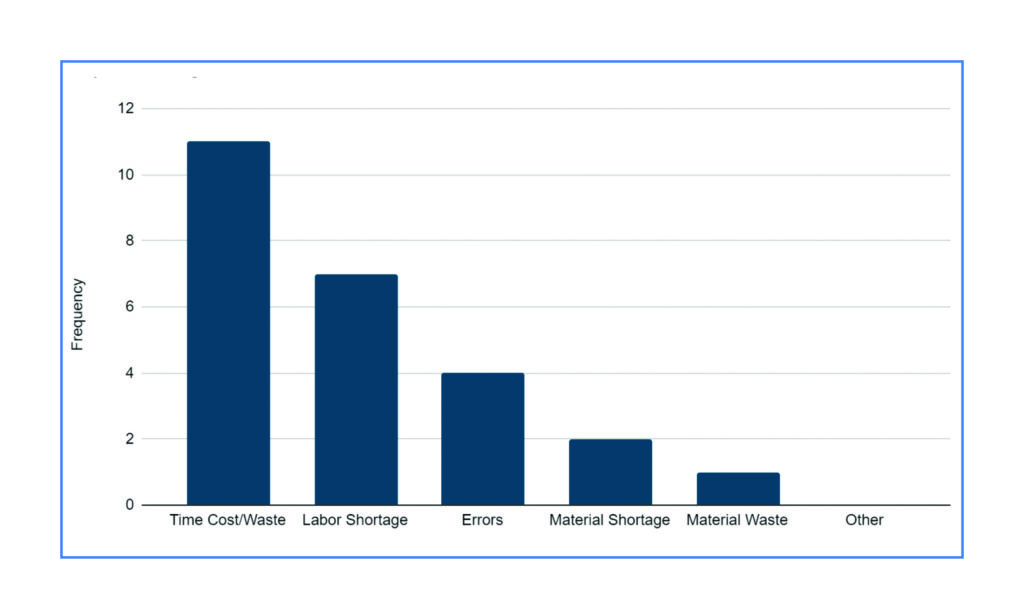
To create a Pareto Chart, simply chart the problem causes, or inputs, in order of highest to lowest frequency of occurrence. This will immediately show which causes should be your highest priority to address.
Below is an example of a Pareto Chart, showing actual categories of root causes of issues in real modular factories. As you can see, Time Waste and Labor Shortage constitute the majority of the causes of challenges in these factories, so addressing these causes first will yield the greatest return.

Start Simple
In addition to the basic tools I’ve described here, much more advanced statistical analysis can be conducted on your data to give you even more insight into the nature, degree and causation of the various potential causes of your issues. But even a basic analysis of the data you’re gathering, as described above and with full participation of your process team, can take you a long way toward understanding what’s causing a process to underperform.
Once you’ve completed your analysis and identified your most likely causes of problems, you can begin designing and implementing solutions. That’s the Improve phase, and it will be the subject of next month’s article.
Daniel Small is a Denver-based management consultant to the building industry. He specializes in Lean Construction and Manufacturing and Six Sigma methodologies. Contact him at [email protected]


[…] to uncover the underlying reasons for the wastes. (For more information on these tools, see “Modular Process Optimization: Step 3”, from the September 2022 issue of Offsite Builder. See also the Fishbone diagram […]